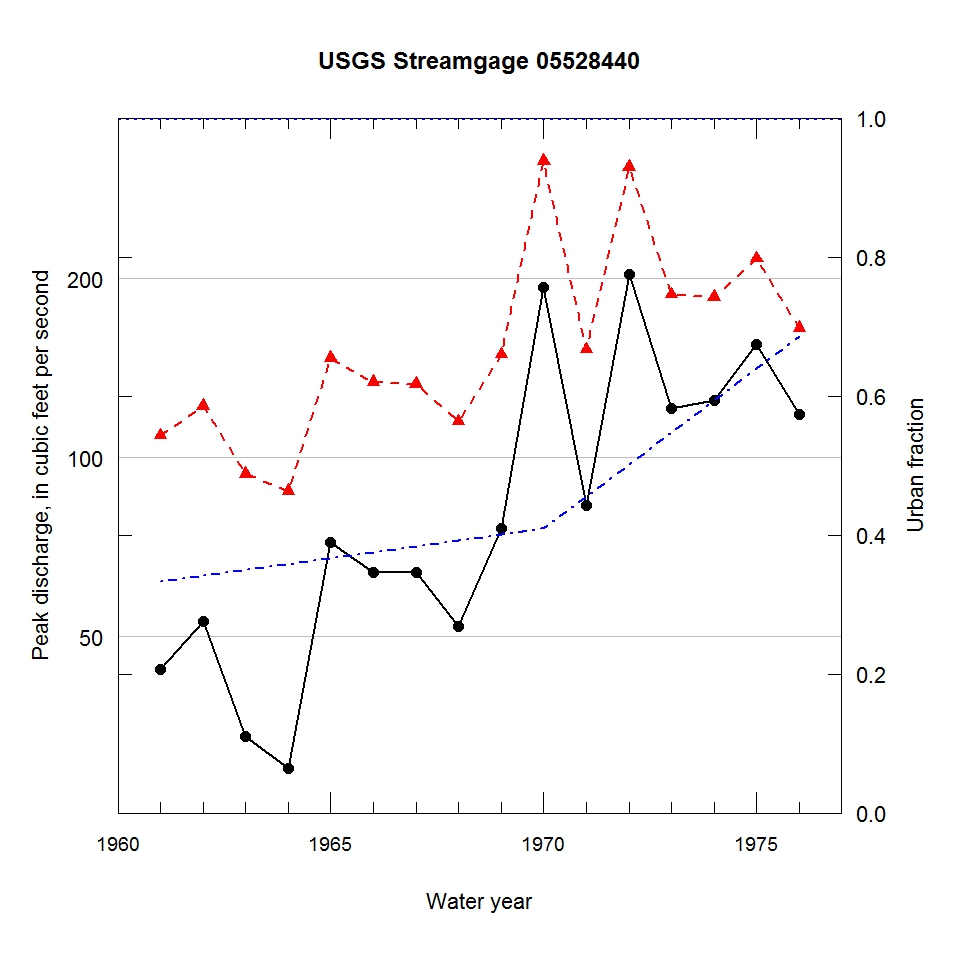
Observed and urbanization-adjusted annual maximum peak discharge and associated urban fraction and precipitation values at USGS streamgage:
05528440 BUFFALO CREEK NEAR LAKE ZURICH, IL


| Water year | Segment | Discharge code | Cumulative reservoir storage (acre-feet) | Urban fraction | Precipitation (inches) | Observed peak discharge (ft3/s) | Adjusted peak discharge (ft3/s) | Exceedance probability |
| 1961 | 1 | 2 | 0 | 0.333 | 1.214 | 44 | 109 | 0.809 |
| 1962 | 1 | 2 | 0 | 0.342 | 0.261 | 53 | 122 | 0.724 |
| 1963 | 1 | -- | 0 | 0.350 | 1.258 | 34 | 94 | 0.902 |
| 1964 | 1 | -- | 0 | 0.358 | 1.731 | 30 | 88 | 0.929 |
| 1965 | 1 | -- | 0 | 0.367 | 0.094 | 72 | 147 | 0.531 |
| 1966 | 1 | -- | 0 | 0.375 | 0.475 | 64 | 134 | 0.629 |
| 1967 | 1 | -- | 0 | 0.384 | 0.923 | 64 | 133 | 0.636 |
| 1968 | 1 | 2 | 0 | 0.392 | 1.246 | 52 | 115 | 0.769 |
| 1969 | 1 | -- | 0 | 0.400 | 1.340 | 76 | 149 | 0.518 |
| 1970 | 1 | -- | 0 | 0.409 | 1.509 | 193 | 315 | 0.042 |
| 1971 | 1 | -- | 0 | 0.455 | 0.415 | 83 | 152 | 0.496 |
| 1972 | 1 | -- | 0 | 0.501 | 1.197 | 203 | 308 | 0.045 |
| 1973 | 1 | -- | 0 | 0.547 | 1.434 | 121 | 188 | 0.264 |
| 1974 | 1 | -- | 0 | 0.593 | 1.113 | 125 | 186 | 0.273 |
| 1975 | 1 | -- | 0 | 0.639 | 0.820 | 155 | 216 | 0.171 |
| 1976 | 1 | -- | 0 | 0.685 | 1.256 | 118 | 165 | 0.413 |

